How to Calculate Share of Voice for Your Brand
September 14, 2025

Calculating your brand’s share of voice is all about sizing up your visibility against the entire market. Think of it as figuring out what percentage of the total conversation—whether that’s through social media mentions, ad impressions, or organic traffic—actually belongs to you. It's a surprisingly powerful way to see where you truly stand.
What Share of Voice Really Tells You
Before we get into the nuts and bolts, let’s talk about what Share of Voice (SOV) actually means in the real world. Forget the textbook definitions for a second. At its core, SOV is a direct pulse check on your brand's presence within your industry's conversation. It answers one simple, yet critical, question: How much attention are you getting compared to your competitors?
This isn't just about counting mentions; it’s a gut check for your brand's health and influence. A higher SOV almost always goes hand-in-hand with a bigger market share and stronger brand recall. It’s the metric that tells you if your marketing is actually cutting through the noise or if your competitors are the ones making all the waves.
The Evolution From Traditional to Digital
This whole concept has been around for ages. PR and ad agencies started out calculating share of voice by measuring their slice of the pie in newspaper inches or TV airtime. Now, we’ve brought that same idea into the digital world, where it’s a lot more complex but also a lot more insightful. Today, we're tracking everything from social media chatter to search engine rankings.
For instance, one consumer electronics brand recently tracked 120,000 online mentions during a major product launch. When they tallied up the competition's mentions—a combined 480,000—they realized they owned a solid 20% SOV. That's a significant chunk of the conversation. Armed with that knowledge, they tweaked their content strategy and saw a 15% lift in social engagement over the next year. This is a perfect example of SOV in action.
This shift shows that SOV is no longer just a simple advertising metric. It's a living, breathing indicator of how well your brand connects with people where it counts.
Key Takeaway: Share of Voice is far from a vanity metric. It’s a competitive benchmark that draws a straight line between your brand's visibility and its potential to grow. A healthy SOV signals that you're a leader in your space, not just another player on the field.
Why Mastering SOV is Non-Negotiable
When you get down to it, tracking SOV gives you intelligence you can act on. It helps you:
- Benchmark performance: Know exactly where you stand against your biggest rivals on any given channel.
- Identify opportunities: See where your competitors are dropping the ball and find openings to dominate the conversation.
- Measure campaign impact: Show the real-world ROI of your marketing efforts with tangible proof of increased visibility.
- Inform strategy: Make smarter calls on where to put your marketing dollars to get the biggest bang for your buck.
By mastering this calculation, you stop guessing about your market position and start knowing it. That knowledge is indispensable for anyone who's serious about building a brand that doesn't just compete, but actually wins. It also feeds directly into the success of your broader communications, and you can learn more about what is media relation in our detailed guide.
The Share of Voice Formula, Unpacked

When you get right down to it, the math behind Share of Voice isn't nearly as intimidating as it sounds. It’s really just about putting your brand’s performance into perspective.
The core formula gives you a powerful, straightforward way to see how your visibility stacks up against the entire competitive field.
Here it is: (Your Brand's Metrics / Total Market Metrics) x 100
Let's break down what those two pieces actually mean in the real world.
Your Brand's Metrics: This is the top part of the fraction—the numerator. It’s a specific performance metric for your brand alone over a certain period. This could be your number of social media mentions, your website's organic clicks, or impressions from a PPC campaign. It’s what you achieved.
Total Market Metrics: This is the bottom part of the fraction—the denominator. This number represents the combined total of that same metric for your brand plus all the competitors you’re tracking. Think of this as the size of the entire pie you’re all fighting for.
So, if you wanted to figure out your SOV on social media, you’d take your total brand mentions and divide them by the combined mentions of your brand and your key competitors. That simple calculation tells you exactly how much of the conversation your brand actually owns. It’s a fundamental measure of marketing impact, as detailed in this guide to calculating SOV on influencity.com.
How the Formula Adapts to Different Channels
The real beauty of the SOV formula is how flexible it is. The core calculation—your slice divided by the whole pie—never changes. What does change are the specific data points you plug in, depending on which marketing channel you're analyzing.
This adaptability is what makes Share of Voice such an indispensable tool for looking at your entire marketing picture.
Think of the formula as a universal key. The key itself doesn't change, but it can unlock different doors—whether that's SEO, paid ads, or social media. The principle of comparison is always the same.
To make this completely clear, I've put together a quick table showing which metrics you'll need for the most common marketing channels. This should give you a solid starting point for gathering the right data, which is exactly what we're diving into next.
Quick Guide to Calculating SOV by Channel
This table breaks down the core formula, showing what "Your Brand Metric" and "Total Market Metric" mean in the context of different channels.
| Channel | Your Brand Metric (Numerator) | Total Market Metric (Denominator) |
|---|---|---|
| Organic Search (SEO) | Your site's organic clicks or impressions for target keywords. | The combined organic clicks or impressions for you and your competitors. |
| Paid Media (PPC) | Your ad campaign's total impressions. | The total estimated impressions available in the market for your ads. |
| Social Media | Your brand's total mentions, hashtag uses, or engagement. | The total mentions and engagement for you and all competitors combined. |
With these examples, you can see how the same simple logic applies everywhere. Now, let’s get into the specifics of finding and collecting this data.
Sourcing the Data for an Accurate Calculation

Any Share of Voice (SOV) calculation is only as good as the data you feed it. We've all heard the old saying, "garbage in, garbage out"—and when it comes to SOV, it's a critical warning. Before you even think about formulas, you need to get your hands dirty with the foundational work: defining your market and identifying who you’re really up against.
This isn't as simple as just listing off the big players in your space. The real challenge is pinpointing the rivals who are actively fighting for your audience's attention on the specific channels you care about. If you run a local coffee shop, your competitors are the other cafes on your street, not a multinational chain on the other side of the country.
Defining Your Competitive Landscape
Before you fire up any data tools, the first step is to create a focused list of competitors. I see people make two common mistakes here: they either go way too broad and try to track every brand in their industry, or they're too narrow and only focus on their one main rival. The sweet spot is somewhere in the middle.
Think about your competitors in a few different buckets:
- Direct Competitors: These are the obvious ones. They offer a similar product or service to the same people you do. For a B2B SaaS company selling project management software, this is every other project management platform out there.
- Indirect Competitors: These brands solve the same problem for your customer, just with a different solution. For that same SaaS company, an indirect competitor could be a simple productivity app or even a set of complex spreadsheet templates.
- Aspirational Competitors: Who are the market leaders you look up to? Including one or two of these brands can give you a powerful benchmark to aim for, even if you aren't fighting them for customers day-to-day.
Once you have that list dialed in, you need to pick your battlegrounds. You can't track everything, so decide which channels matter most. Is your focus on dominating organic search results? Is it all about the chatter on social media? Or is your main goal to get more visibility with paid ads? Your answer will shape where you go looking for data.
My Two Cents: Don't treat your competitor list like it's set in stone. Markets change. New players show up out of nowhere and established ones can fade away. I recommend revisiting your list every quarter to make sure your SOV numbers are still telling you an accurate story.
Gathering Metrics from Key Channels
Alright, you know who you’re tracking and where you’re tracking them. Now it's time to hunt down the raw numbers. The tools you use will depend entirely on the channel, but the most important thing is consistency. If you're measuring social mentions, use the same tool to measure your brand and every competitor on your list. This ensures you're making a fair, apples-to-apples comparison.
For Social Media and PR Mentions
Social listening platforms are your go-to here. Tools like Brandwatch or Talkwalker are fantastic for automatically tracking mentions, hashtags, and even sentiment for your brand and your competitors. Many of these can also keep an eye on media mentions in online articles and blogs, which is a huge help for measuring your PR impact. If you're looking to put this process on autopilot, checking out some different PR automation tools and top platforms compared can help you find the right technology for your team.
For Organic Search Visibility
For this, you absolutely need SEO software. Platforms like Ahrefs or Semrush are the industry standard. They track how you and your competitors rank for a shared list of important keywords and estimate how much organic traffic those rankings are worth. This data is exactly what you need to plug into the SOV formula for search.
For Paid Media Impressions
This is often the most clear-cut channel to measure. If you're running ads on Google, for example, the platform gives you a metric called Impression Share. This percentage tells you exactly how often your ads were shown versus the total number of times they could have been shown for your targeted auctions. It’s a direct, ready-made measurement of your paid SOV.
Putting The SOV Formula To Work Across Key Channels
Once you’ve nailed down the data you need, it’s time to actually run the numbers. The real magic of Share of Voice is its flexibility—the same core idea applies whether you're tracking Instagram buzz, organic search rankings, or paid ad visibility.
Let’s walk through a few real-world scenarios to see how this plays out on different channels.
This simple flow shows the basic steps, no matter where you're measuring.
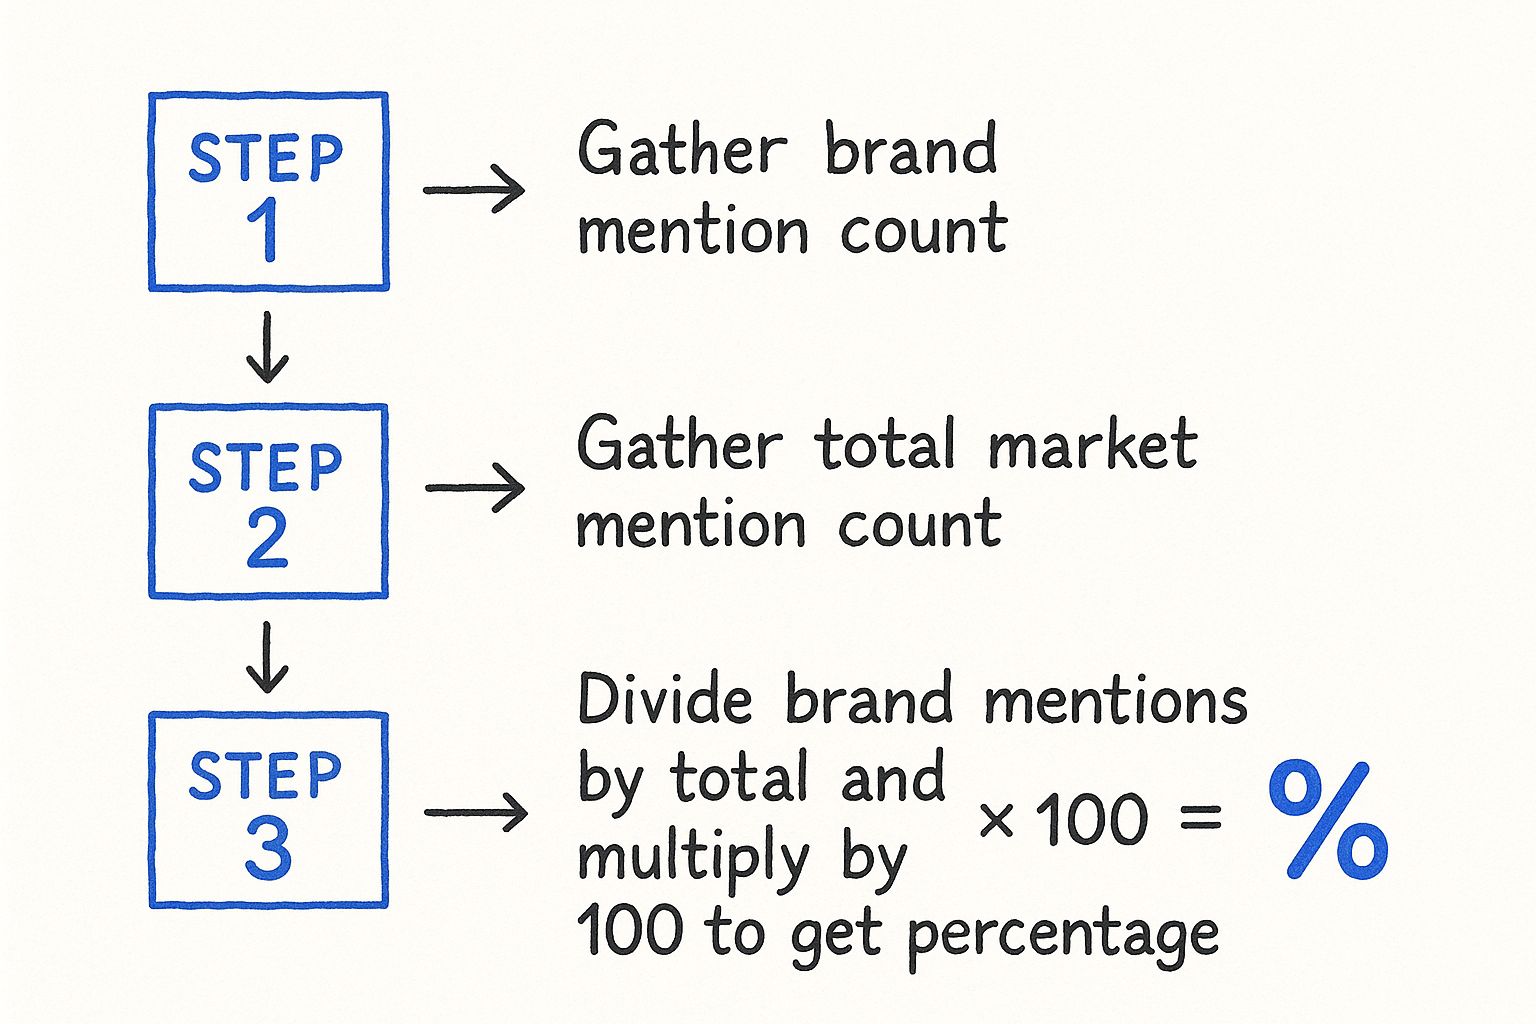
As you can see, it's all about dividing your brand’s slice of the pie by the total size of the pie. Simple as that.
How To Calculate Social Media SOV
Picture a new local coffee shop, "The Daily Grind." They want to gauge their presence on Instagram against their two biggest local competitors, "Morning Brew Cafe" and "Espresso Corner." The goal is to see who's driving the most conversation over the past 30 days.
First, the team at The Daily Grind fires up a social listening tool to track every mention of their brand handle and any branded hashtags. They do the exact same thing for their two rivals.
Here's what their data looks like:
- The Daily Grind: 250 total mentions
- Morning Brew Cafe: 400 total mentions
- Espresso Corner: 350 total mentions
The Total Market Mentions is just the sum of everyone's mentions: 250 + 400 + 350 = 1,000 mentions.
Now, they just plug their number into the formula: (250 / 1,000) x 100 = 25% SOV
This tells The Daily Grind they currently own exactly a quarter of the Instagram chatter in their local market. Not bad for the new kid on the block.
Nailing Down Organic Search SOV
Let's switch gears to a B2B software company that sells HR analytics tools. They need to understand their organic SOV for five of their most important industry keywords, measured against three main competitors. An SEO platform like Ahrefs or Semrush is perfect for this, as they can pull click-share data that estimates the percentage of clicks each website gets for those keywords.
Here’s the breakdown for the last month:
- Our B2B Company: 15% click share
- Competitor A: 30% click share
- Competitor B: 25% click share
- Competitor C: 10% click share
To find the Total Market Click Share, they add it all up: 15% + 30% + 25% + 10% = 80%. The other 20% of clicks are scattered across smaller blogs and publications.
Their SOV calculation looks like this: (15% / 80%) x 100 = 18.75% SOV
The result is a clear signal: while they're on the board, they're still a relatively small voice in the organic search conversation for these money-making terms. This kind of insight is crucial for building an effective outreach strategy. In fact, understanding what is media outreach is often the next logical step for B2B brands trying to build up that authority and grab a bigger share.
Measuring Paid Media SOV
Finally, let's look at paid media, where SOV is most often called Impression Share. The great thing here is that ad platforms like Google Ads serve this metric up on a silver platter.
An e-commerce brand selling running shoes logs into their Google Ads account and sees their campaign has an Impression Share of 45%.
This number means their ads were shown in 45% of all the searches they were eligible to appear in. So, their paid SOV is 45%. The platform also tells them they're losing 30% of impressions because their budget is too low and another 25% because their ad rank isn't high enough.
This is incredibly actionable data. They are the most visible advertiser at the moment, but they could nearly double their presence by allocating more budget and working to improve their Quality Score.
Comparison of SOV Calculation Tools
Choosing the right tool is key to getting accurate data without spending all day pulling reports. Different platforms excel at different channels.
| Tool Name | Best For (Channel) | Key Features for SOV | Pricing Model |
|---|---|---|---|
| Brandwatch | Social Media, Forums | Tracks mentions, hashtags, and sentiment; robust competitor benchmarking and dashboards. | Subscription (Custom) |
| Ahrefs | Organic Search (SEO) | Tracks keyword rankings and estimates organic traffic share for any domain. | Subscription (Tiers) |
| Semrush | Organic & Paid Search | Provides "Market Share" reports for keywords and competitor ad spend analysis. | Subscription (Tiers) |
| Google Ads | Paid Search (PPC) | Built-in "Impression Share" metric to directly measure paid SOV on Google. | Pay-per-click |
| Sprout Social | Social Media | Social listening features combined with publishing and analytics for a full-suite tool. | Subscription (Per User) |
Each of these tools offers a different lens through which to view your market presence, so the best choice often depends on which channel matters most to your brand's growth.
Turning Your SOV Insights into a Winning Strategy

Alright, so you’ve done the hard work and calculated your share of voice. That percentage is a huge milestone, but it’s what comes next that really counts. Think of that number not as the finish line, but as the starting block for making genuinely smarter marketing moves. The real magic begins when you translate that raw data into a real competitive advantage.
Your SOV figure is essentially a diagnostic tool. It shows you exactly where you stand right now, but it doesn't hand you a map for where to go. The first thing I always do is benchmark this number against direct competitors on each specific channel. For example, knowing you have 15% of the social media conversation is interesting. But discovering your closest rival has a whopping 45%? That’s the kind of context that forces you to take action.
Interpreting Your Channel-Specific Results
Your SOV is almost never going to be consistent across every platform, and that’s a good thing. Those variations are where your biggest opportunities are hiding. A low SOV in one area paired with a high SOV in another gives you a crystal-clear roadmap for where to put your time and money.
Don’t ever look at a low score as a failure—see it for what it is: an untapped market.
Let’s say your organic search SOV is in the basement. That's a direct signal to double down on your SEO. In practice, this could mean:
- Digging for long-tail keywords your competitors have completely overlooked.
- Getting serious about building high-quality backlinks to lift your domain authority.
- Creating genuinely helpful, in-depth content that actually solves your audience's problems better than anyone else.
On the flip side, if your paid media SOV is already strong, the game changes from acquisition to optimization. Instead of just fighting for eyeballs, you can get surgical. Focus on refining ad creative, tightening up your audience targeting, and squeezing every drop of value from your ad spend. This pivot ensures you’re always putting your energy where it will have the most impact.
From Data Points to Actionable Plans
Now, let's get practical and turn these insights into a concrete plan. The goal is to create specific, measurable actions based on what your channel-specific SOV is telling you. This is how you stop just knowing your share of voice and start actively growing it.
A low social SOV, for instance, means people simply aren't talking about you. Your action plan should be all about sparking that conversation. You could start experimenting with different content formats like short-form video, run interactive polls to get people involved, or even partner with influencers to tap into their ready-made communities.
By tracking SOV over time—I recommend monthly or quarterly—you create an invaluable feedback loop. You can directly tie a spike in your SOV to a specific campaign, giving you solid proof of your marketing ROI and making it much easier to justify future budget requests.
If your PR and media SOV is lagging behind, it’s time to get a lot more strategic with your outreach. Maybe your press releases are just plain boring, or you’re sending great stories to the wrong journalists. At PressBeat, we see this happen all the time. The brands that take the time to personalize their pitches and tell a compelling story are the ones who see their media mentions—and their share of voice—climb. This is where a data-driven strategy meets smart execution to create real, tangible growth.
Common Questions About Share of Voice
https://www.youtube.com/embed/o-MxGURNAXY
Even with a clear formula in hand, a few practical questions always pop up once you start digging into the data. Let's walk through some of the most common ones I hear from marketers, so you can clear up any confusion before you start.
How Often Should I Calculate My Share of Voice?
For most businesses, running the numbers on a monthly basis is the sweet spot. This gives you enough time to collect meaningful data and see how your marketing efforts are moving the needle, but it won't have you drowning in spreadsheets. It also lines up nicely with most content and reporting schedules.
That said, if your industry is particularly fast-paced or you’re in the middle of a short, intense push—like a major product launch—you might want to ramp that up to weekly tracking.
The key, no matter what, is consistency. Measuring weekly one month and quarterly the next just won't give you a clear, reliable picture of your performance over time. Pick a cadence and stick to it.
What Is a Good Share of Voice Percentage?
This is the million-dollar question, and the honest-to-goodness answer is: there’s no magic number. Your "good" SOV is entirely relative to your specific market and who you're up against.
Instead of getting hung up on an arbitrary percentage, I always tell people to focus on two things:
- Your rank: Where do you actually sit in the pecking order? Being third out of four competitors tells a completely different story than being third out of fifty.
- Your growth: Is your SOV trending up? Seeing that percentage climb month after month is one of the best signs that your strategy is working.
Here's a pro tip: A fantastic goal is to get your share of voice higher than your actual market share. Research consistently shows that brands whose SOV outpaces their market share are primed for growth. It means you're punching above your weight.
Can I Calculate SOV Without Expensive Tools?
Yes, you absolutely can. Premium tools like Ahrefs or Brandwatch are great because they automate a lot of the heavy lifting, but you can still get a solid measurement on a budget. It just takes a little more hands-on work.
You can piece together a pretty reliable estimate using a mix of free resources.
- Google Alerts: A classic for a reason. Set up alerts for your brand name and your top competitors to manually track mentions across the web.
- Social Media Searches: Use the built-in search functions on platforms like X (formerly Twitter) and LinkedIn. Tracking brand mentions and key industry hashtags here is essential.
- Google Ads: Your account gives you Impression Share data for free. This is a direct measure of your SOV on the paid search front.
- Free SEO Tools: Many of the big SEO platforms offer free versions that let you track keyword rankings for a core set of terms, giving you a glimpse into your organic SOV.
This manual approach is definitely more time-intensive, but it still delivers the core insights you need to understand your market position and make smarter decisions.
Ready to boost your media mentions and dominate the conversation? PressBeat uses AI to connect your story with the right journalists, helping you secure the high-impact press coverage you deserve. See how it works at https://pressbeat.io.