How to Effectively Measure Public Relations Impact
November 19, 2025

Getting a real sense of PR impact starts with clear, business-driven goals. From there, pick metrics that show awareness, engagement, and conversion.
A handful of media monitors, analytics suites, and social listening platforms will gather your raw data. Then apply an attribution model to tie placements back to revenue or brand trust. Finally, roll those insights into a single dashboard for quick stakeholder updates.
Practical Steps For Measuring Public Relations
First, define objectives that link directly to your bottom line. Maybe you want to increase your share of voice by 15% or boost referral traffic from earned media by 20%.
Here’s how it comes together in practice:
- Goals Clarify Success: Decide whether you’re chasing share of voice, lead generation, or another outcome.
- Metrics Track Progress: Use sentiment scores, backlink counts, web traffic spikes, and conversion rates to monitor movement.
- Data Collection Tools: Leverage media monitoring, web analytics, and social listening platforms for comprehensive coverage.
- Attribution Mapping: Employ UTM parameters or multi-touch models to connect media hits with actual business results.
- Dashboard Visualization: Build a clear interface with charts and summaries that speak straight to stakeholders.
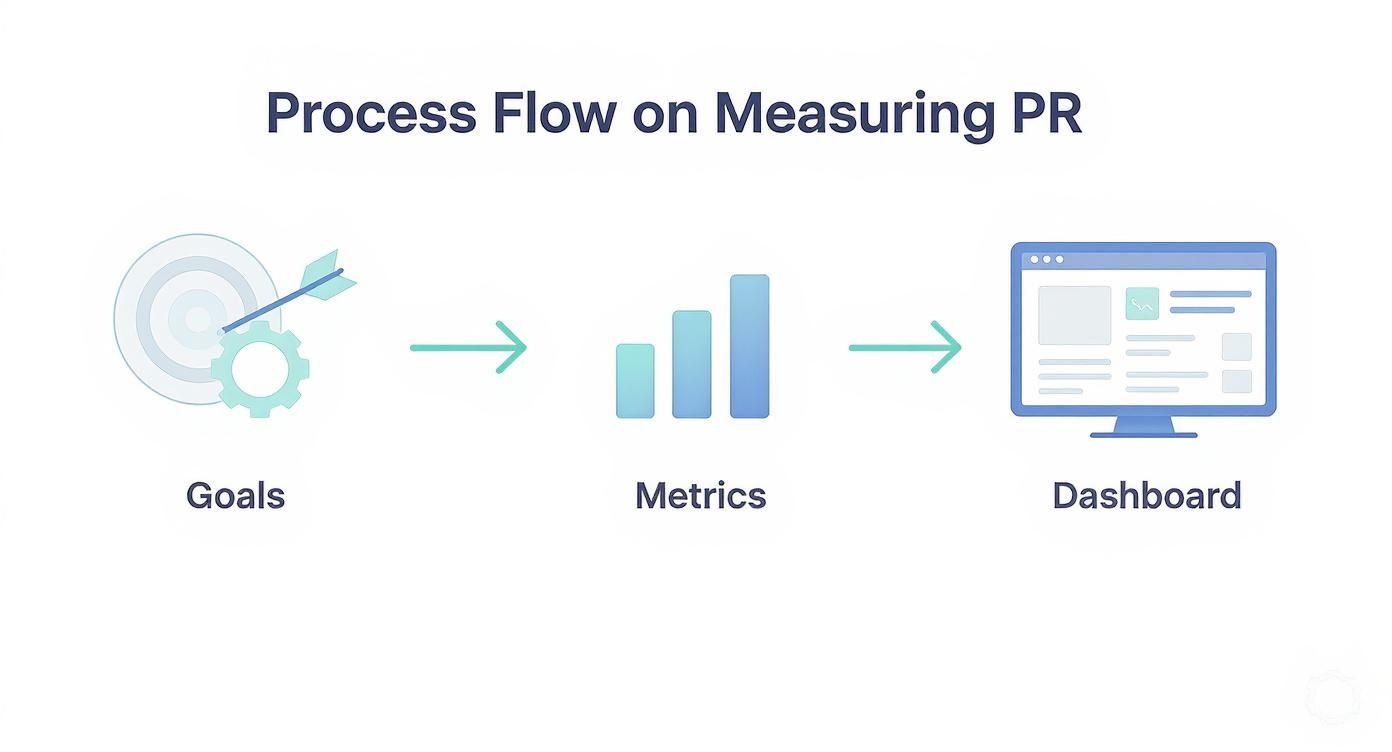
This flowchart shows how each phase flows into the next, creating a continuous measurement cycle.
Essential PR Measurement Metrics At A Glance
Below is a quick reference table showing core KPI categories, what they actually track, and go-to tools for collecting that data.
| Metric Category | What It Measures | Example Tool |
|---|---|---|
| Reach | Total audience size based on media impressions. | Cision |
| Sentiment | Ratio of positive versus negative mentions. | Brandwatch |
| Backlinks | Number and authority of earned links. | Ahrefs |
| Traffic | Referral visits coming from PR placements. | Google Analytics |
| Conversions | Leads or sales directly tied to PR efforts. | HubSpot |
Use this table as your starting point to decide which metrics to prioritize and which platforms to lean on.
With the public relations sector expected to top $132.52 billion by 2029, you can’t afford guesswork. Dive deeper into these projections on ResearchAndMarkets.com.
"Consolidating metrics into a visual dashboard makes PR impact clear for stakeholders."
Next Steps For PR Measurement
Draft your own measurement framework using the steps above. Tweak goals and metrics each month so you keep pace with shifting priorities.
Sit down with stakeholders on a regular cadence to walk through the dashboard. Let the data guide your tactics and keep everyone aligned on the big picture.
Stay proactive.
Defining PR Goals That Drive Business Value
When you track PR, it starts by translating your company’s vision into clear, measurable objectives. Aimless targets simply drain resources and make it hard to demonstrate real progress.
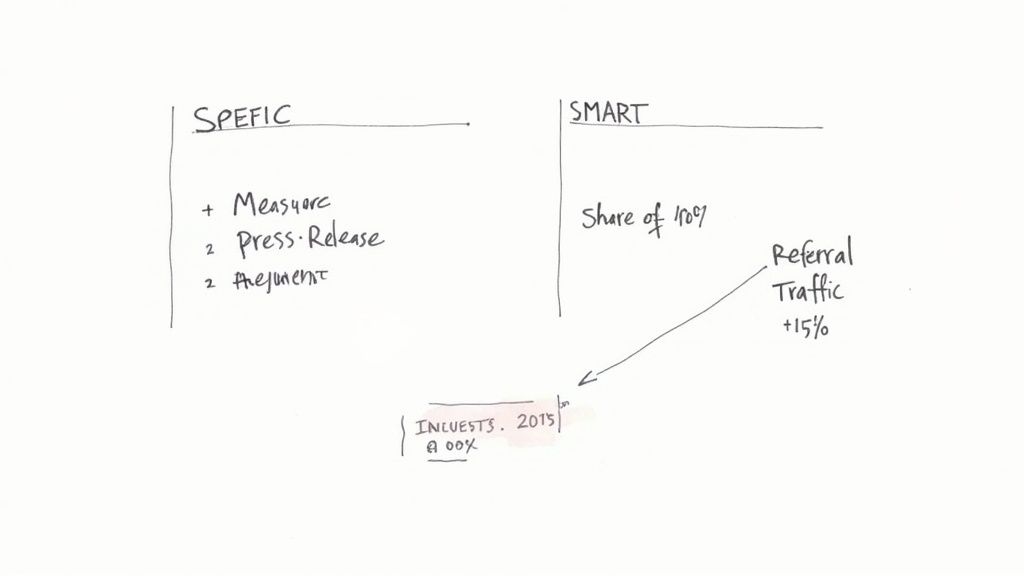
A solid framework here is the familiar SMART goals approach. By breaking down each aim into specific, measurable, achievable, relevant, and time-bound elements, you get a transparent blueprint for success.
- Specific: Decide exactly which metric moves the needle.
- Measurable: Outline how you will collect data.
- Achievable: Set benchmarks rooted in historical performance.
- Relevant: Tie the goal back to sales, growth, or other core outcomes.
- Time-Bound: Add a deadline to spark urgency.
Translate Objectives Into PR Targets
Begin by jotting down your key business goals and then ask: how can PR play a part? For instance, if leadership wants to grab more market share, focus on increasing your share of voice in top-tier outlets.
In one example, a team aimed to boost share of voice by 20% over six months. They homed in on high-authority tech publications, which sharpened their pitching process and made results easy to report.
- Grow referral traffic from earned media by 15%.
- Secure qualified leads through strategic press placements.
- Elevate your brand sentiment score by two points.
Case Study From A B2B Tech Company
Picture a B2B SaaS startup with big ambitions: they wanted PR to fuel Marketing Qualified Leads (MQLs), not just generate headlines. Every mention had to push prospects closer to a purchase decision.
They added UTM parameters to press-release links so every click fed straight into their CRM as a potential lead. From there, the team could trace each earned mention back to real contacts.
- Identified publications that matched their buyer personas
- Established SMART targets for MQLs tied to each story
- Tracked link performance in Google Analytics
- Mapped earned mentions to new leads in HubSpot
Setting Up Tracking Methods
No more guesswork: plug your goals into analytics and watch results flow in. Custom dashboards in Google Analytics, paired with media-monitoring tools, flag shifts in referral traffic and brand sentiment.
| Goal | Metric | Tool |
|---|---|---|
| Share of Voice | % Mentions vs Competitors | Cision |
| Referral Traffic | Visits from Media | Google Analytics |
| MQL Generation | New Leads | HubSpot |
Align Internal Stakeholders
Bringing sales, product, and finance into the conversation early saves headaches later. Host a short workshop to present draft targets and gather input.
- Invite key stakeholders to co-create PR objectives
- Refine targets based on cross-functional feedback
This inclusive process fosters accountability and underscores how each PR metric ties back to revenue or brand health.
Best Practices You Need To Know
Frame your PR goals in financial or pipeline terms—the C-suite will take notice. Treat targets as living documents: revisit them each quarter to stay aligned with changing priorities.
“When PR metrics tie directly back to revenue, stakeholder buy-in follows naturally.”
- Use precise, quantifiable language in reports
- Map every goal to a broader business outcome
- Review progress in cross-team meetings
- Document wins and lessons for ongoing improvement
By weaving these practices into your goal-setting routine, you’ll build a PR measurement process that resonates with leaders and delivers real impact.
Choosing The Right Metrics For Your PR Campaigns
Measuring PR success isn’t just about tallying up impressions. It means picking KPIs that reveal real impact—and steer your strategy forward.
Below, you’ll discover how to balance raw reach with deeper indicators like sentiment, message pull-through, share of voice, backlink authority and referral conversions. These metrics bridge high-level business goals with everyday PR activities.
Identifying Core KPI Categories
Before you dive into dashboards, define the categories that matter most:
Brand Sentiment
Tracks positive, neutral and negative mentions across media and social channels. It tells you whether your audience is nodding along—or shaking their heads.Message Resonance
Measures how often your key talking points show up in coverage. It confirms that your narrative is sinking in.Share Of Voice
Compares your media presence against competitors. This metric gives you context on how loudly you’re speaking in your industry.Backlink Quality
Evaluates the authority of sites linking back to your content. High-domain links boost both SEO and credibility.Referral Conversions
Tracks website actions—form fills, downloads or purchases—driven by earned media links. It’s the clearest line between PR and revenue.
Defining these categories early helps your team zero in on data that drives decisions.
Building A Tiered Measurement System
Grouping metrics by priority keeps everyone focused on what counts:
- Tier 1: Metrics that tie directly to brand health and revenue (e.g., referral conversions, share of voice).
- Tier 2: Engagement indicators, such as message resonance and social interactions.
- Tier 3: Tactical feedback like backlink counts and raw mention volume.
That structure keeps your eye on the big wins without losing sight of smaller victories.
A consumer brand moved away from chasing sheer mention counts and started tracking message pull-through in top outlets. Within three months, those core messages drove a 25% jump in referral traffic.
Influencer collaboration now powers 63.8% of PR campaigns in 2025, underlining how social metrics have become integral. For more on this trend, explore the PR campaign research.
Choosing Tools For Core Metrics
Your toolkit should cover monitoring, listening and analytics in one sweep. Consider these:
- Cision for comprehensive media tracking and share of voice analysis.
- Brandwatch to capture real-time sentiment dashboards and filter by custom keywords.
- Meltwater for broad media coverage and influencer insights.
- Ahrefs or Moz to gauge backlink authority and domain metrics.
- Google Analytics as your go-to for referral conversion tracking with UTM support.
Native social analytics on platforms like Twitter or LinkedIn can fill in the gaps. A D2C brand, for example, used Twitter Analytics to vet tweet resonance before committing budget to deeper Brandwatch reports.
For a deeper dive into setting PR value, check out our comprehensive guide on calculating earned media value.
Interpreting Trends And Patterns
When you track consistently, patterns emerge—some expected, others surprising.
- Map seasonal peaks in coverage to plan big PR pushes.
- Scan competitor metrics for content gaps you can own.
- Apply moving averages to level out daily spikes and dips.
Share concise monthly trend snapshots so stakeholders see shifts in sentiment or share of voice right away. Celebrate wins—like a sustained uptick in positive mentions or growing backlink authority—to keep momentum high.
Balancing Qualitative And Quantitative Metrics
You need both numbers and narrative to tell the full story.
Quantitative data shows you how big a wave is; qualitative context explains why it’s making a splash.
| Metric | Quantitative Measure | Qualitative Insight |
|---|---|---|
| Brand Sentiment | Average sentiment score | Excerpts from top-performing articles |
| Message Resonance | % of coverage items with key phrases | Tone and narrative analysis |
| Backlink Quality | Domain Authority scores | Relevance of referring page content |
| Referral Conversion | Total conversions and conversion rate | Quotes or feedback from converted users |
This side-by-side view highlights where you should dig deeper and where to celebrate quick wins.
Aligning PR Metrics With Business Goals
Linking each metric back to a business objective keeps everyone on the same page:
- Use UTM parameters to tie metrics directly to revenue targets.
- Review KPIs weekly so you can tweak tactics in real time.
- Distribute concise reports to stakeholders to build trust and ensure accountability.
When your metrics ladder up to overarching goals, PR stops feeling like a separate silo—it becomes a measurable driver of growth.
By choosing the right combination of metrics, you’ll create a sturdy framework to measure PR impact and prove your value to leadership. Keep iterating, and watch your PR program become an unstoppable engine for business success.
Implementing Your PR Measurement Toolkit
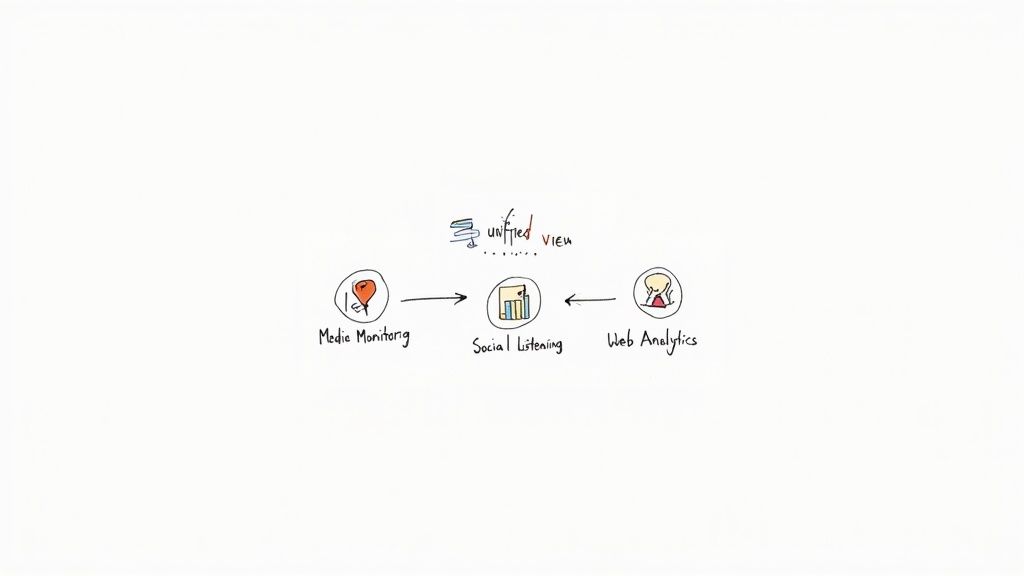
Getting your systems up and running turns ambitions into hard data. You’ll learn how to hook up your favorite platforms so every mention and metric flows into one unified view.
Merging media monitoring, social tools, and analytics stops data from hiding in silos. With timely alerts, you’ll catch every brand mention, whether on news sites or social channels.
- Media monitoring (e.g., Mention) logs each hit—mention count, audience size, and outlet reputation.
- Social listening solutions like Brandwatch detect sentiment shifts, topic clusters, and influencer reach.
- Web analytics platforms such as Google Analytics track referral sessions, behavior on site, and conversions.
Explore our deep dive into PR automation platforms to see the top options side by side.
Configuring Keyword Alerts
Keyword watches breathe life into your dashboards by flagging every time your brand, product names, or executive titles pop up.
You’ll want to filter by geography, language, and channel to cut through irrelevant noise. For example, one nonprofit set up region-specific alerts—guiding on-the-ground teams as they rolled out local fundraising efforts.
- Sign up for Google Alerts to capture basic public mentions.
- Upgrade to a paid service like Meltwater for sentiment tags and audience filters.
- Push notifications into Slack or email so you never miss a critical mention.
Integrating Analytics Dashboards
Custom UTM codes are your best friend when you need to prove that PR drove real traffic.
Once you’ve tagged each outlet—source, medium, and campaign—you can import everything into Google Data Studio for a single, interactive dashboard.
| Tool | Purpose | Highlight |
|---|---|---|
| Media Monitor | Mention Tracking | Instant alerts |
| Social Listener | Sentiment Analysis | Pattern spotting |
| Dashboard Platform | Data Visualization | Drag-and-drop reports |
Automating Weekly Reports
Set up routines that deliver key metrics to your team every Monday morning. A few simple scripts or built-in connectors will pull CSVs or API feeds automatically—no manual exports needed.
- Automate a Slack summary so the team sees the highlights fast.
- Email leadership a snapshot with annotated visuals.
- Archive each week’s data in a shared cloud folder for easy historical comparisons.
Tracking Conversions From PR
URL tags—utm_source, utm_medium, utm_campaign—make conversions traceable in Google Analytics. A typical tag might look like:
utm_source=media_outlet&utm_medium=pr&utm_campaign=fall_launch
When you filter by these parameters, you’ll know exactly which placements drove form submissions or downloads. Pick an attribution model that aligns with your goals:
- First-touch: credits the initial PR mention.
- Linear: spreads credit evenly across every interaction.
- Time-decay: favors mentions closer to the conversion event.
Using AI For Sentiment Analysis
Sentiment engines can sift through thousands of mentions to highlight tone changes and emerging issues. When negative chatter spikes, you get an early warning to take action.
Still, no tool is perfect. Manual spot checks ensure the AI’s output matches real context.
- Match AI results with your brand guidelines.
- Run weekly audits to compare automated sentiment tags against the actual text.
- Add contextual notes to refine the algorithm over time.
Case Study On Nonprofit Dashboard
A nonprofit blended a media monitor, social listener, and Google Data Studio into one dashboard. Over six months, they tracked 4,500 mentions, pulled sentiment data, and measured referral traffic automatically.
“Consolidating those tools into a single view saved us 80% of the time we used to spend on reporting. It freed up a full 10 hours each week for strategic work.”
That kind of integration is exactly where PR measurement stops being a chore and starts fueling smarter decisions.
Monitoring Offline Coverage
Print and broadcast remain high-trust channels, but they often fall off digital radar. Get into the habit of uploading scanned clippings or screenshots into your media monitor regularly.
Next, estimate reach by tapping into published circulation figures or broadcast audience numbers to complete the picture.
- Assign a team member to collect offline mentions every week.
- Include visual evidence—photos, PDFs—alongside your digital metrics.
- Track sentiment trends across both online and offline channels.
- Note any dashboard tweaks, with dates and details, for an audit trail.
By weaving these elements together, your PR toolkit becomes a center of insight rather than a set of silos. Review your setup quarterly to stay aligned with new channels and shifting business priorities. Remain curious and adjust your approach as your company grows.
Connecting PR Activities To Business Outcomes
Proving PR’s impact means moving beyond raw coverage counts. When you align every mention with sign-ups, sales or brand lift, you turn PR into a revenue driver.
Attribution Models You Can Use
Choose the model that matches your goals and data complexity:
First-Touch
Credits the very first mention with full conversion value.Linear
Splits credit evenly across every touchpoint in the customer journey.Time-Decay
Gives increasing weight to mentions closest to the conversion event.
A SaaS startup rolled out a Linear approach around a feature story in a leading tech outlet. Over a 30-day period, each appearance shared equal credit for demo sign-ups—revealing which publications consistently moved the needle.
Key Attributes At A Glance
- First-Touch highlights where prospects first discovered your brand.
- Linear makes sure no single placement hogs all the credit.
- Time-Decay emphasizes the mentions that directly precede conversions.
“Linear attribution gave our team confidence that every mention mattered,” explains the SaaS marketing lead.
Tracking Conversions With UTM
Embedding UTM parameters in your press-release links brings surgical precision to your reporting. Tagging source, medium and campaign lets you trace referrals in Google Analytics.
Example setup:
- utm_source=tech_site
- utm_medium=press
- utm_campaign=feature_launch
Once that data flows in, you can map each demo sign-up back to its originating article. Check out our guide on measuring marketing ROI for even more attribution tactics.
Aligning UTM data with CRM entries builds a clean pipeline. Every demo request shows exactly which media placement sparked the lead.
Measuring Offline And Broadcast Coverage
Not all wins happen online. Print clippings and broadcast transcripts still drive awareness, so you need a way to quantify them.
- Upload scanned PDFs of print mentions into your media monitor.
- Log TV or radio hits alongside your digital stats.
- Assign someone to collect offline clips each week.
- Use a simple template to note date, outlet and estimated audience.
Effective PR measurement combines digital precision with traditional reach estimates.
Globally, the public relations agencies sector reached an estimated market revenue of $68.7 billion in 2025, framing the rising emphasis on media reach, share of voice, and sentiment analysis within modern PR practices. Learn more about these market insights on IBISWorld.
Tips To Connect More Dots
- Build a unified dashboard that layers UTM data, attribution outputs and offline reach.
- Schedule monthly reviews to catch emerging patterns.
- Prioritize mentions tied to high conversion rates or strong sentiment shifts.
Bringing these elements together transforms scattered PR stats into a narrative your executives can trust.
SaaS Startup Use Case
One SaaS team noticed a TechCrunch shout-out coincided with a surge in free trials. By tagging every link with UTM parameters and feeding the data into a linear model, they traced 120 demos directly back to that article. Comparing this to traditional PR value estimates showed that sharing credit across touches offered a fairer assessment than first-touch alone. Armed with those insights, they secured a 20% boost in PR budget for the next quarter.
Common Challenges And Solutions
Offline mentions rarely include click data, and broadcast exposure can be regionalized.
- For print, rely on clip tracking and circulation figures for reach estimates.
- For TV and radio, pull in audience share or Nielsen ratings.
- Use follow-up surveys or spikes in social listening as proxies for offline buzz.
Combine these methods with your digital analytics to build a comprehensive view of PR performance.
Creating Dashboards That Tell a Compelling Story
Data on its own feels flat. It’s the narrative woven around your numbers that makes stakeholders sit up and pay attention.
A compelling dashboard doesn’t just list stats; it walks your audience through reach, sentiment, and conversion milestones with clarity. Imagine swapping raw impression figures for a line chart that highlights sentiment swings after each press push—suddenly those peaks and valleys make sense.
Here’s how to organize your dashboard so it feels intuitive:
- Lead with your most impactful metrics, such as website conversions and share of voice.
- Use H3 subheadings—Audience Growth, Engagement Trends, Conversion Paths—to group related data.
- Pair each chart with a concise quote or key insight to bring your PR victories to life.
When time is tight, templates become your best friend. I’ve built a Google Sheets sample you can copy in seconds, tweaking it for either your marketing crew or executive team.
Dashboard Templates For Different Audiences
Marketing teams crave detail: weekly tabular reports that track every tweak. A simple eight-column layout—date, outlet, reach, sentiment, backlinks, site traffic, leads, notes—lets PR managers filter by channel or timeframe on the fly.
Executives? They prefer the big picture. Skip the columns and dive into an executive summary highlighting the top three trends, a conversions chart, and your key insights.
| Audience | Preferred Format | Key Metrics |
|---|---|---|
| Marketing Team | Tabular Weekly | Reach, Sentiment, Backlinks, Traffic, Leads |
| Leadership | Executive Summary | Top 3 Trends, Conversions Chart, Key Insights |
Swap in line graphs for trend analysis and funnel charts for conversion paths—whatever best illustrates your story.
“Seeing sentiment improve by 30% month over month convinced our CEO that PR moves the needle.”
That kind of qualitative context shows exactly how audience reactions propelled those spikes.
Adding Qualitative Insights And Key Takeaways
Numbers tell you what happened. Quotes from coverage or social listening explain why it mattered.
Below each graph, include a bullet list of main learnings:
- How you tackled challenges (for instance, refining messaging after feedback).
- Unexpected wins, like a viral mention that netted bonus backlinks.
- Next steps inspired by the data, such as testing a fresh outreach angle.
These notes balance your figures with the narrative that drove them.
Sample Google Sheets Dashboard You Can Adapt
I put together a starter dashboard you can clone in under five minutes. It features prebuilt charts for sentiment trends, reach over time, and a referral conversion funnel.
- First, open the sheet and adjust the channel filters.
- Then replace the example data with your own metrics.
- Finally, annotate each chart with a short insight for that period.
Swap in your brand colors and logo to make it feel like yours. Share the live link with stakeholders so everyone sees up-to-the-minute results.
Bringing It All Together
Structure, visuals, and narrative combine to transform raw data into a memorable PR story.
- Schedule a monthly walkthrough to highlight fresh takeaways and collect feedback.
- Archive dashboard snapshots to benchmark growth and illustrate momentum over time.
With this approach, your dashboards become more than spreadsheets—they become the story of your PR success.
Frequently Asked Questions About PR Measurement
When you’re asked how to prove PR success, the immediate challenges often center on quick wins and long-term impact. This FAQ tackles those head-on, offering hands-on advice for startups and marketing teams.
Almost any team can track two core indicators in under an hour:
- Set up Google Alerts (https://www.google.com/alerts) to capture every mention as it happens—zero cost and zero fuss.
- Dive into Google Analytics (https://analytics.google.com) to spot referral traffic spikes from earned media.

Measuring brand perception means marrying data with narrative.
“Sentiment scores tell you what was said; message resonance shows whether it stuck.”
Surveys let you chart shifts in awareness and favorability over time—numbers and stories in one view.
Tracking Brand Perception With Surveys
Before you roll out a campaign, run a quick pulse poll. Do the same immediately after it wraps. You’ll see how awareness and sentiment move in real time. For seamless automation, try tools like SurveyMonkey or Typeform. They’ll handle the heavy lifting and deliver clear sentiment scores.
Proving PR ROI Without Direct Attribution
No direct sales link? No problem. Lean on leading indicators to build your ROI case:
- Watch referral session growth in Google Analytics to gauge audience spikes.
- Track domain authority changes with Ahrefs reports for long-term SEO lift.
| Metric Category | Metrics To Track | Why It Matters |
|---|---|---|
| Website Traffic | Referral sessions from PR | Reveals new audience engagement |
| Lead Quality | Organic referral MQLs | Signals higher purchase intent |
| Backlink Authority | Domain rating & referring domains | Strengthens search visibility |
Review those KPIs every week. Notice a downward trend? Tweak your outreach. Spot a surge? Double down on what’s working.
Align each metric to your quarterly goals. Then iterate—small tweaks lead to measurable growth.
Ready to amplify your PR results today? Get started with PressBeat